
Overzicht van de werking en probleemoplossing van omgekeerde osmose
Industrial reverse osmosis (RO) systems are essential for producing high-quality water across many industries. While highly reliable, variations in feedwater quality, production demands, and operating conditions can affect performance. Understanding key indicators and following a structured troubleshooting approach helps operators identify issues early, maintain stable operation, and optimize membrane lifetime.
Key Performance Indicators (KPIs)
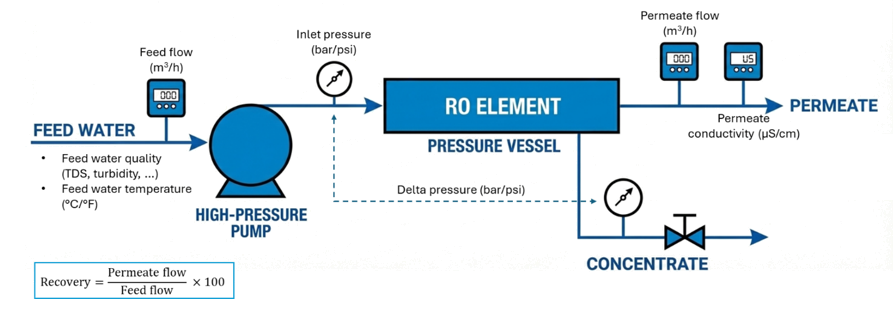
The following table lists the key performance parameters that operators should monitor during RO operation.
Understanding each KPI and how variations can influence other parameters is essential for effective troubleshooting.
|
KPI |
Definition |
Typical variations / interactions |
Possible causes on RO operations |
|
Permeate flow |
Volume of purified water produced (m³/h or GPM) |
- Decreases with lower temperature, high ΔP, fouling/scaling |
Fouling, scaling, membrane compaction, low feed temperature |
|
Salt rejection / permeate conductivity |
% of salts removed (measured via conductivity, µS/cm) |
- Increases/decreases with feedwater TDS, temperature, recovery - Drops if fouling, or chemical attack occurs |
Membrane aging, fouling, scaling, high recovery, chemical exposure |
|
Differential Pressure (ΔP) |
Pressure difference across each membrane stage (bar/psi) |
- Increases with fouling, scaling- Higher recovery → slightly higher ΔP |
Fouling, scaling, varying hydraulic conditions |
|
Feed pressure (after High-Pressure Pump) |
Pressure of feedwater entering the first membrane stage (bar/psi) |
- Directly affects permeate flow and recovery - Low feed pressure → lower flow and reduced recovery |
Fouling, scaling, pump performance issues, clogged feed filter, feedwater variability |
|
Recovery |
Ratio of permeate flow to feedwater flow (%) |
- Higher recovery → higher permeate conductivity & ΔP - Higher recoveryà higher risk for fouling and inorganic scaling |
Operator setpoint changes, production demand, design limitations |
|
Feedwater quality |
Include following parameters: TDS, turbidity, organics, SDI, temperature, hardness, silica, … |
- High TDS → increases osmotic pressure, reduces flow - High SDI, turbidity, organics → faster fouling |
Seasonal variations, upstream pretreatment issues |
|
Temperature |
Feedwater temperature (°C/°F) |
- Low → reduces permeate flow - High → increases flow, decreases permeate quality |
Seasonal changes, process water heating/cooling |
Additional definitions:
- Fouling: Accumulation of particles, organics, or biofilm on membranes; caused by high SDI, organics, or microorganisms.
- Scaling: Deposition of salts (e.g., CaCO₃, CaSO₄, silica) when solubility limit is exceeded; caused by high hardness, alkalinity, or silica in feedwater, especially at high recovery.
Early warning signs
Recognizing early warning signs helps to prevent irreversible damage, unnecessary cleaning, or premature membrane replacement:
- Gradual decrease in permeate flow despite constant feedwater conditions → possible fouling or scaling
- Sudden drop in salt rejection after cleaning or chemical dosing → potential chemical attack or membrane damage
- Fluctuating permeate conductivity → may indicate feedwater variation, scaling, or partial fouling
- Rising ΔP across stages → fouling or scaling accumulation
- Low or fluctuating feed pressure → may be caused by pump issues, clogged filters, or valve misalignment
- Frequent or ineffective CIP → cleaning may not address the actual cause
Troubleshooting workflow
Following a structured workflow ensures that issues are addressed efficiently and effectively:
- Data collection: Record operating parameters (flow, feed pressure, ΔP, conductivity, recovery, temperature) and feedwater quality over time.
- Normalization: Adjust for temperature, salinity, and recovery to evaluate true membrane performance. Distinguish normal variations from actual degradation.
- Identify potential causes: Use normalized trends to detect fouling, scaling or operational deviations. Look for correlations between KPIs and feedwater quality.
- Corrective action & CIP evaluation:
- Perform targeted cleaning based on fouling or scaling type.
- Adjust recovery, pressure, or pretreatment as necessary.
- Track CIP effectiveness by comparing normalized KPIs before and after cleaning.
- Optimize chemical choice, concentration, temperature and contact time.
- Advanced diagnostics: If performance does not improve, consider membrane autopsy or lab analysis to confirm fouling, scaling deposits, or membrane damage.
Why this matters:
- Prevents unnecessary cleaning or membrane replacement.
- Reduces operational costs and downtime.
- Maintains water quality and system reliability.
- Supports continuous improvement and optimization.
Operator guidance
- Record baseline performance for each stage after commissioning.
- Normalize operational data regularly to track true trends.
- Use combined KPI behavior to prioritize maintenance activities.
- Evaluate CIP effectiveness using normalized post-cleaning KPIs.
- Address multiple contributing factors rather than one isolated symptom.
How Lenntech can support RO operation and troubleshooting
Lenntech supports industrial operators in maintaining stable and efficient reverse osmosis operation by combining system knowledge, operational analysis, and practical field support. Our services cover:
- Review and interpretation of operating and normalized performance data
- Support in identifying fouling, scaling, and performance loss mechanisms
- Support with cleaning strategies, pretreatment optimization, and operational adjustments
- On-site service, inspections, and troubleshooting support
- Coordination of membrane inspection and autopsy when required
- Long-term performance monitoring and operational optimization
This approach supports reliable RO operation, helps prevent recurring issues, and contributes to sustainable water management across industrial applications.
For more information or quotation, please contact us:  Feedback Form or call us on +31 152 610 900